 Bytesweep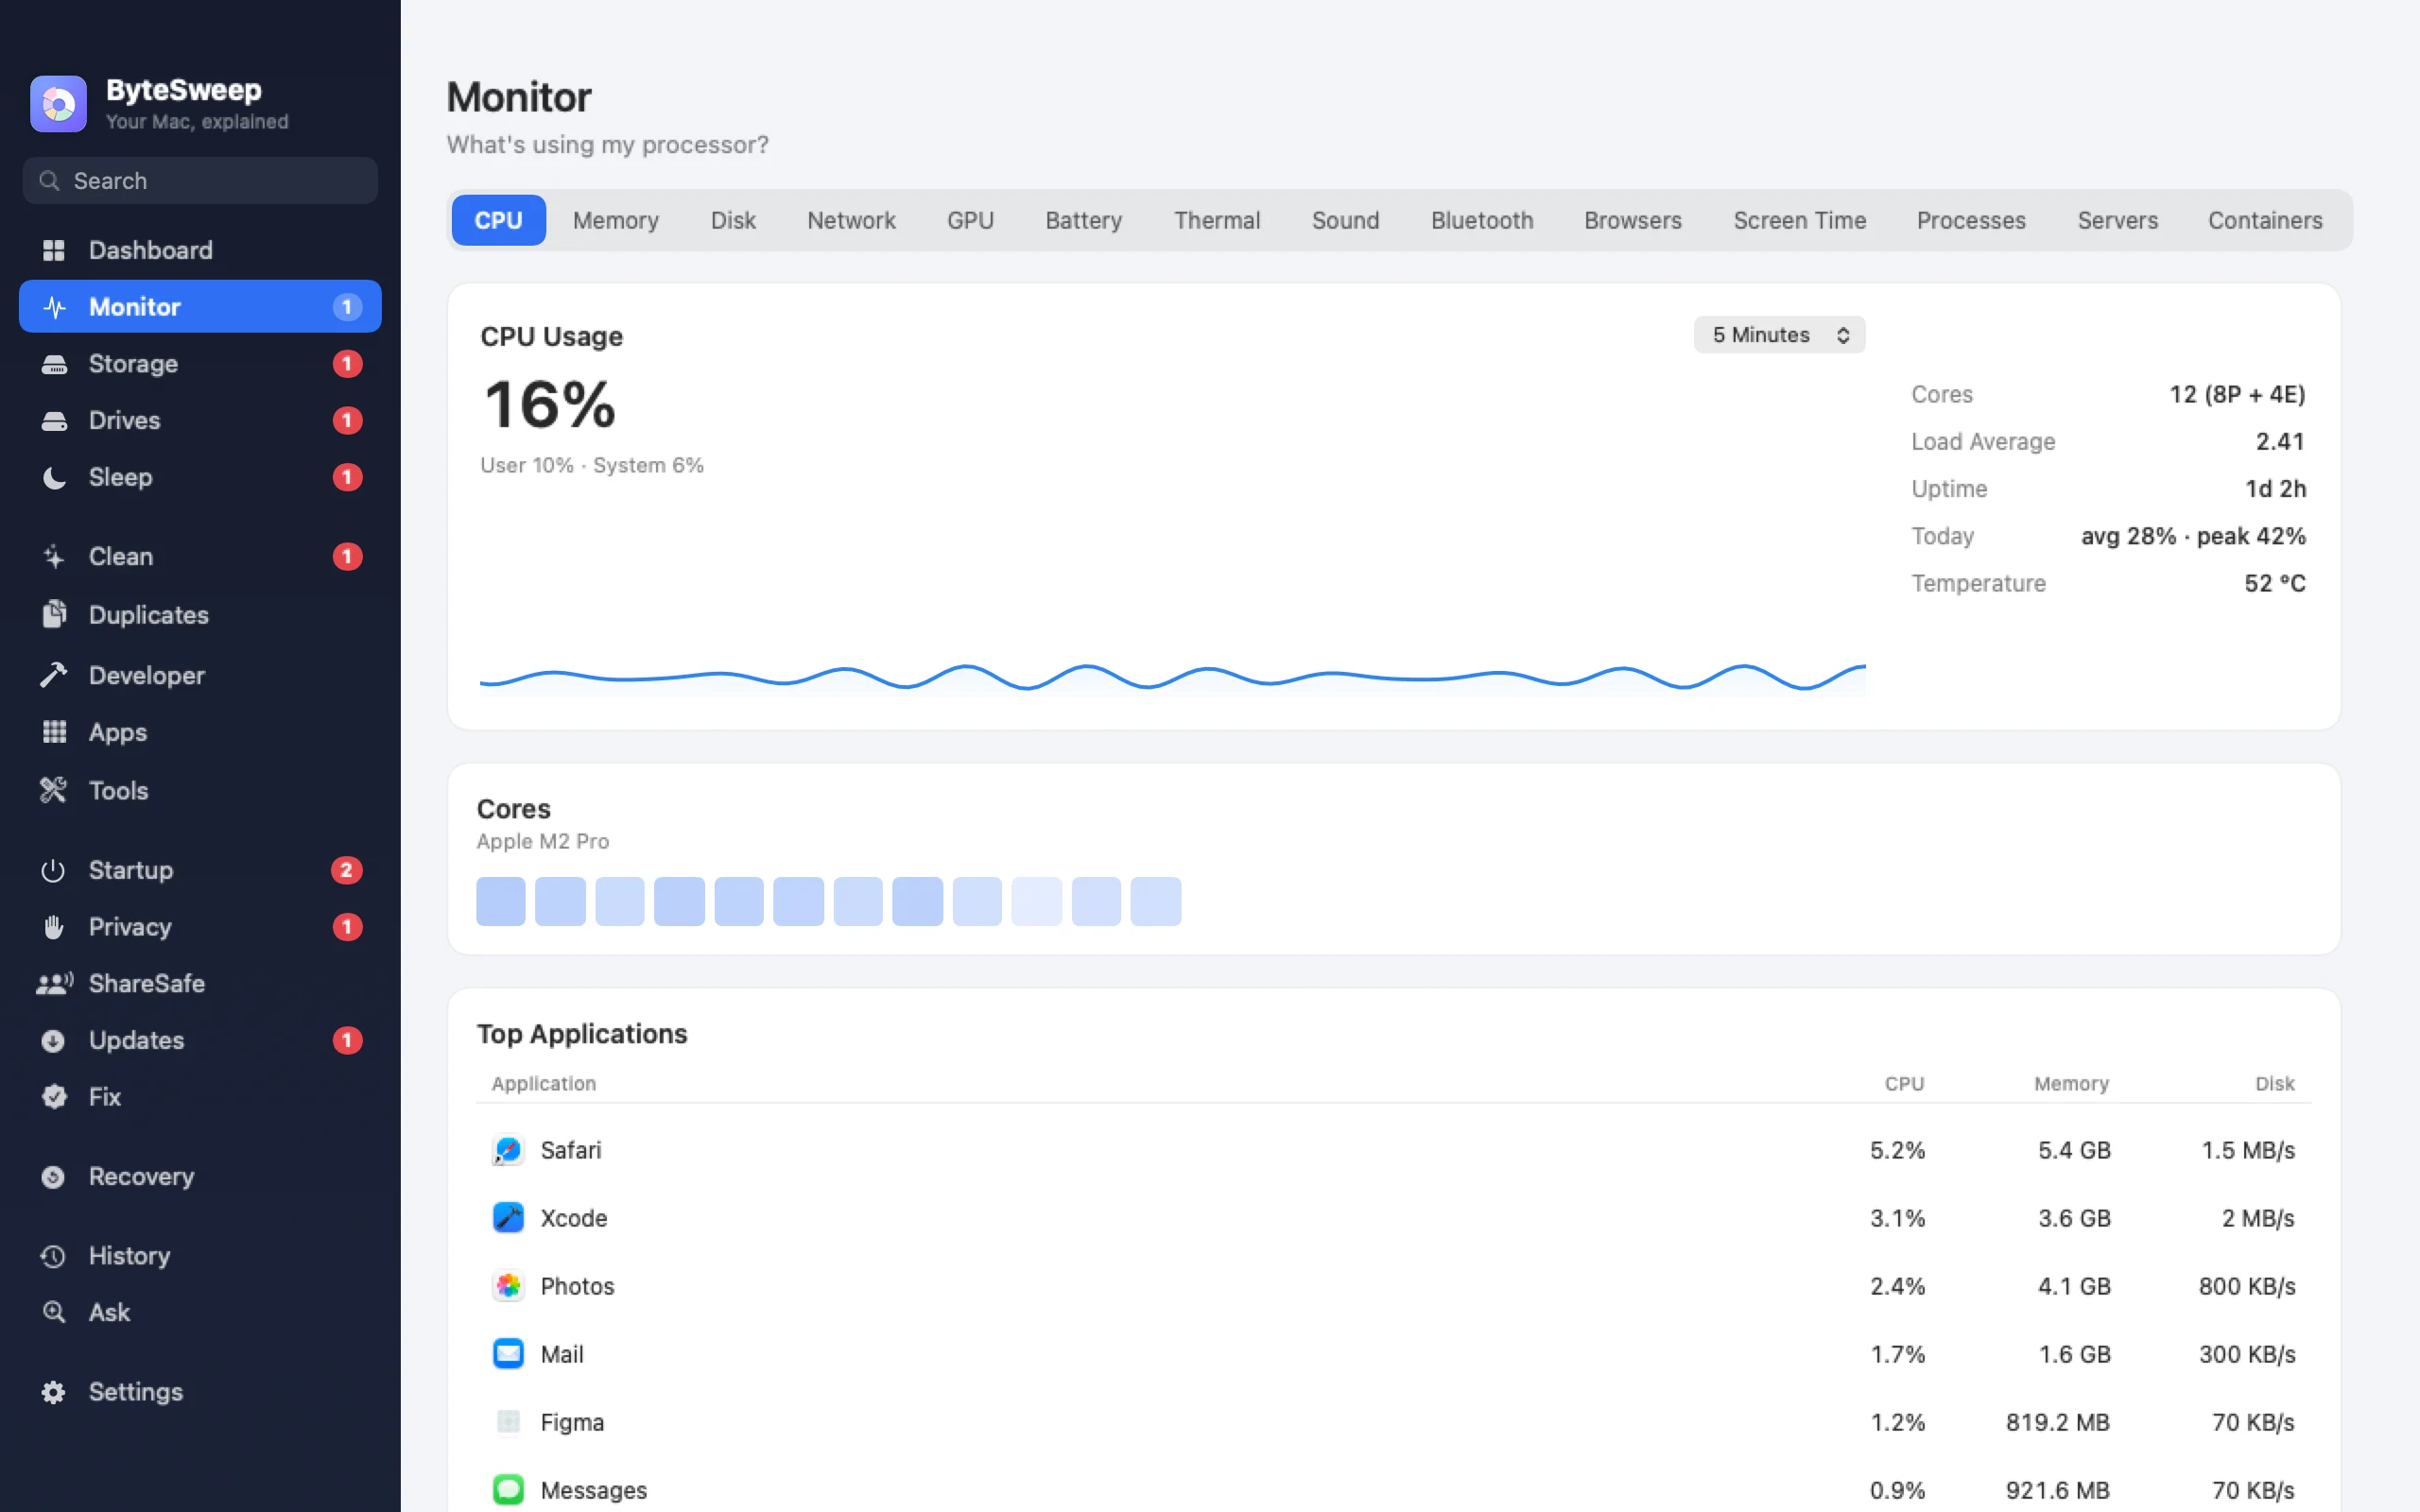
Every reading in one window
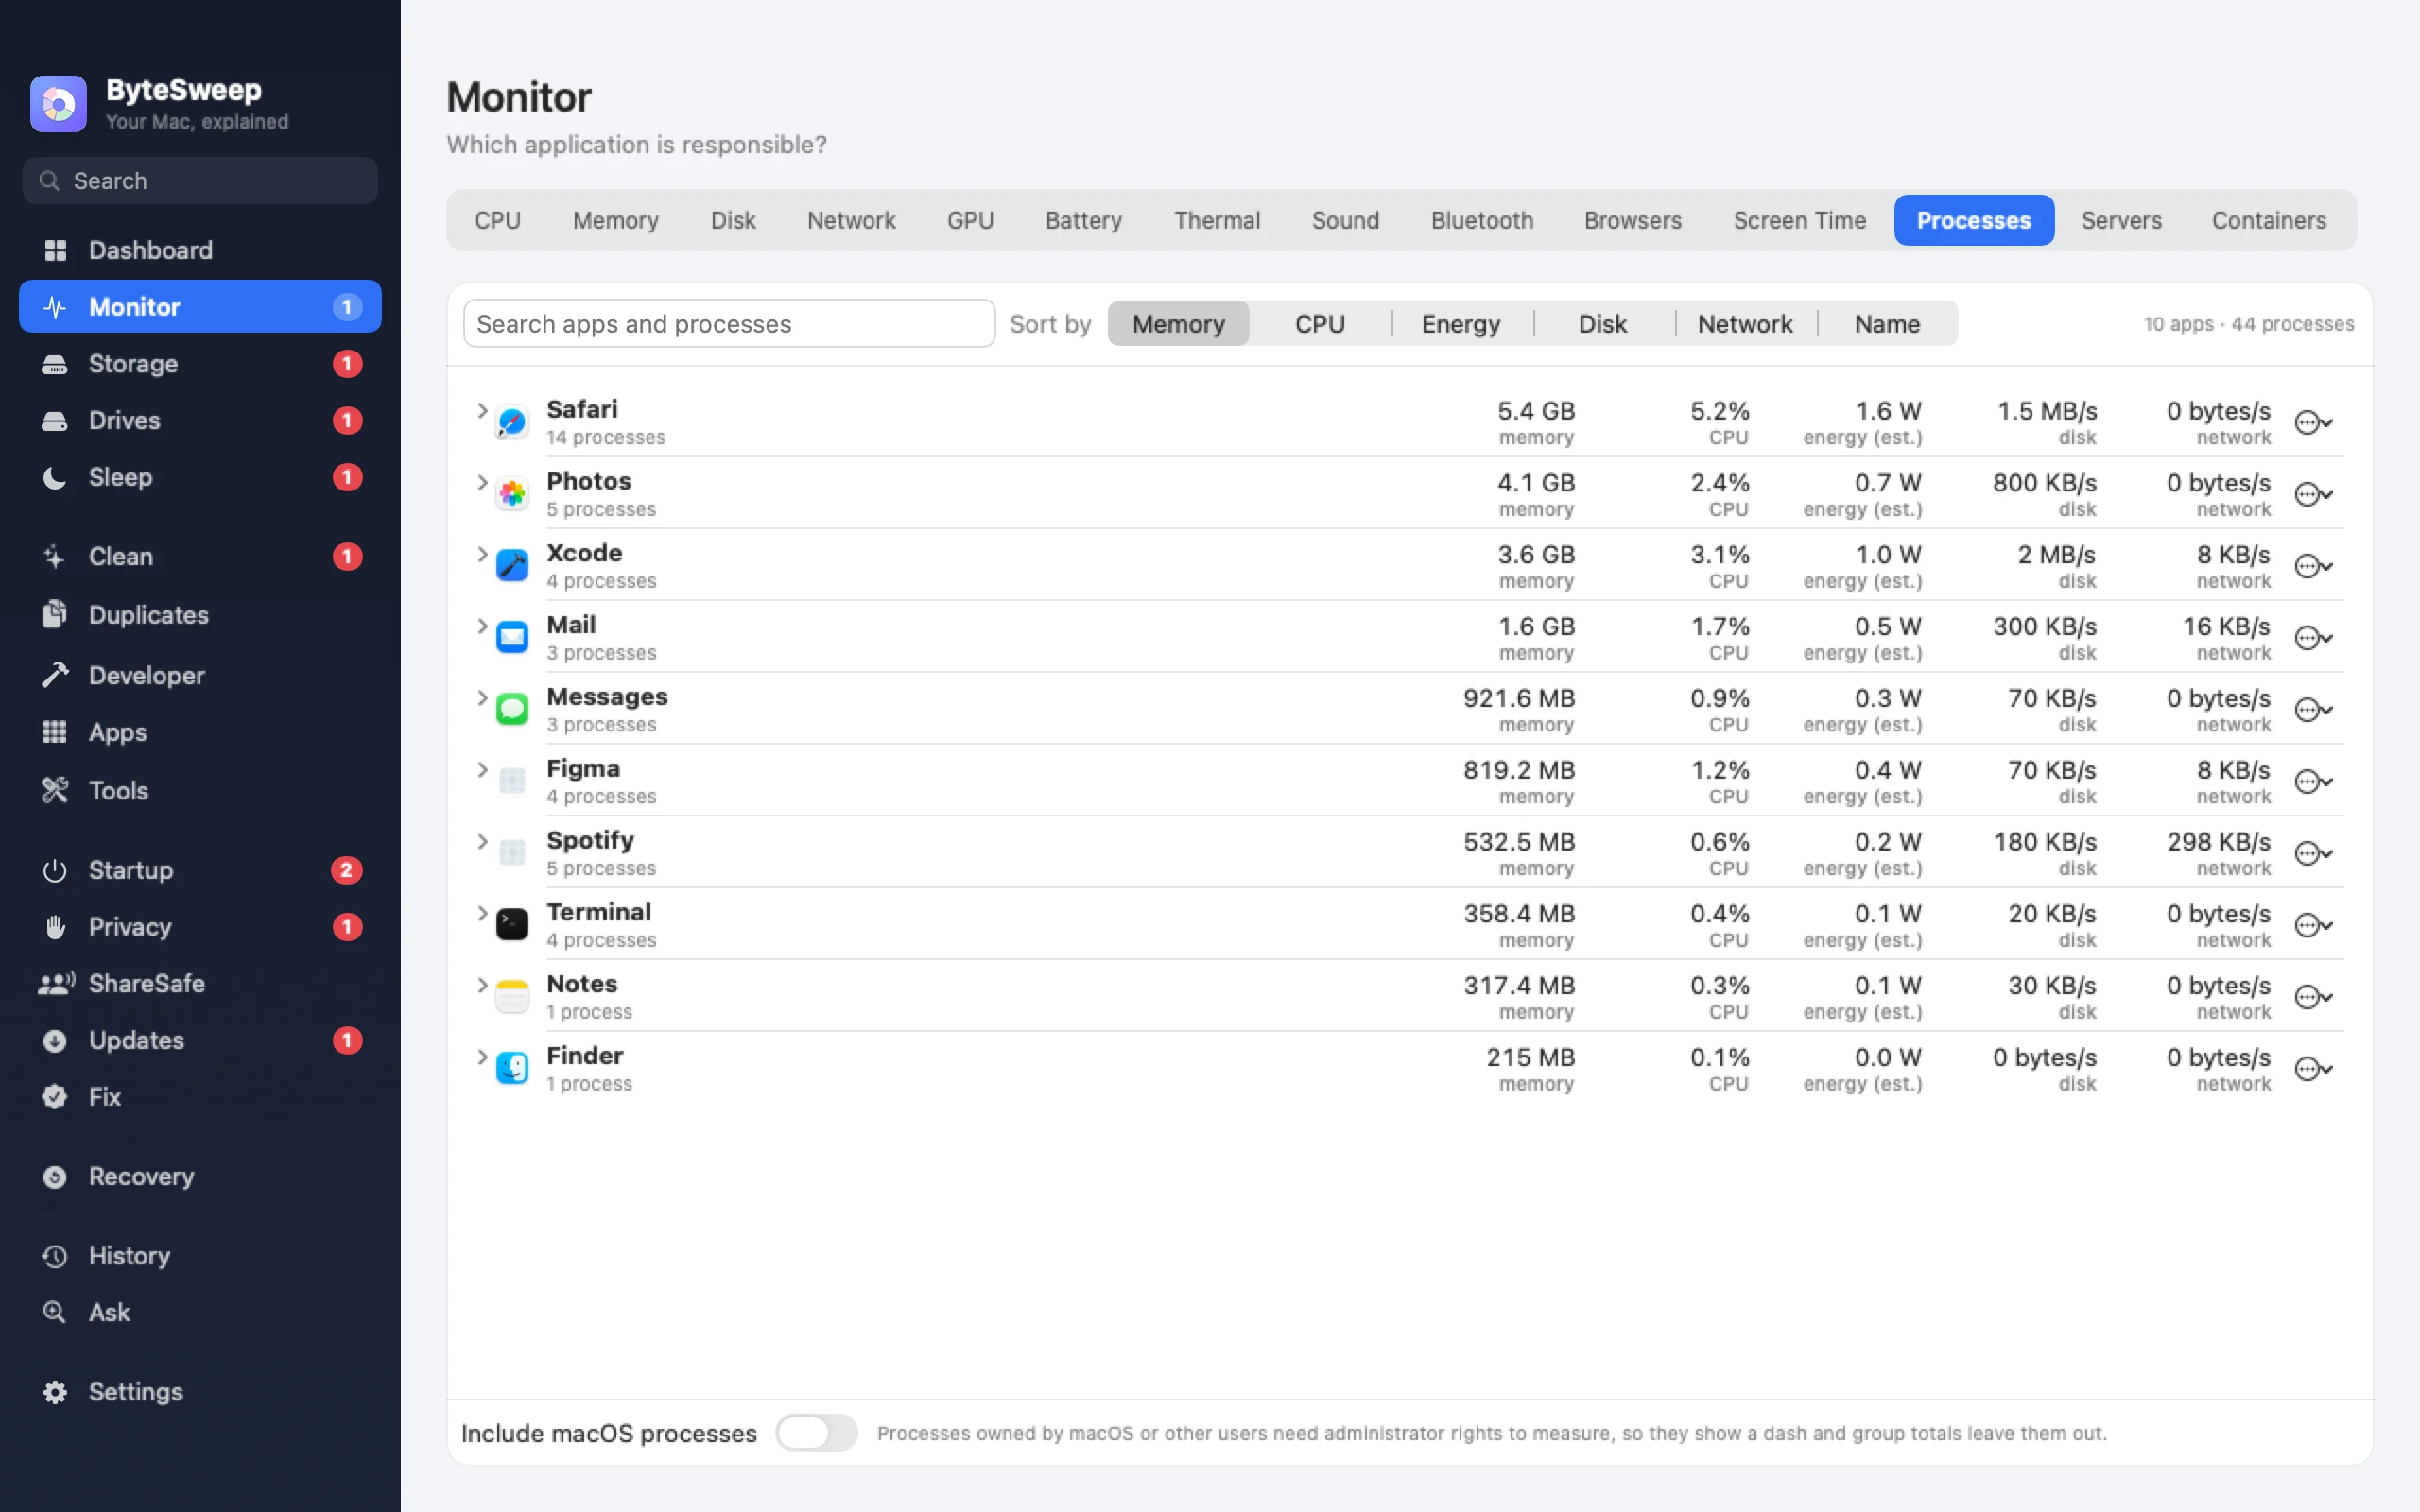
Monitor has a page for each part of the machine: CPU, memory, disk, network, GPU, battery and temperatures. Processes are grouped by the app they belong to, so twenty helper processes show up as one browser, not twenty lines you have to add up.
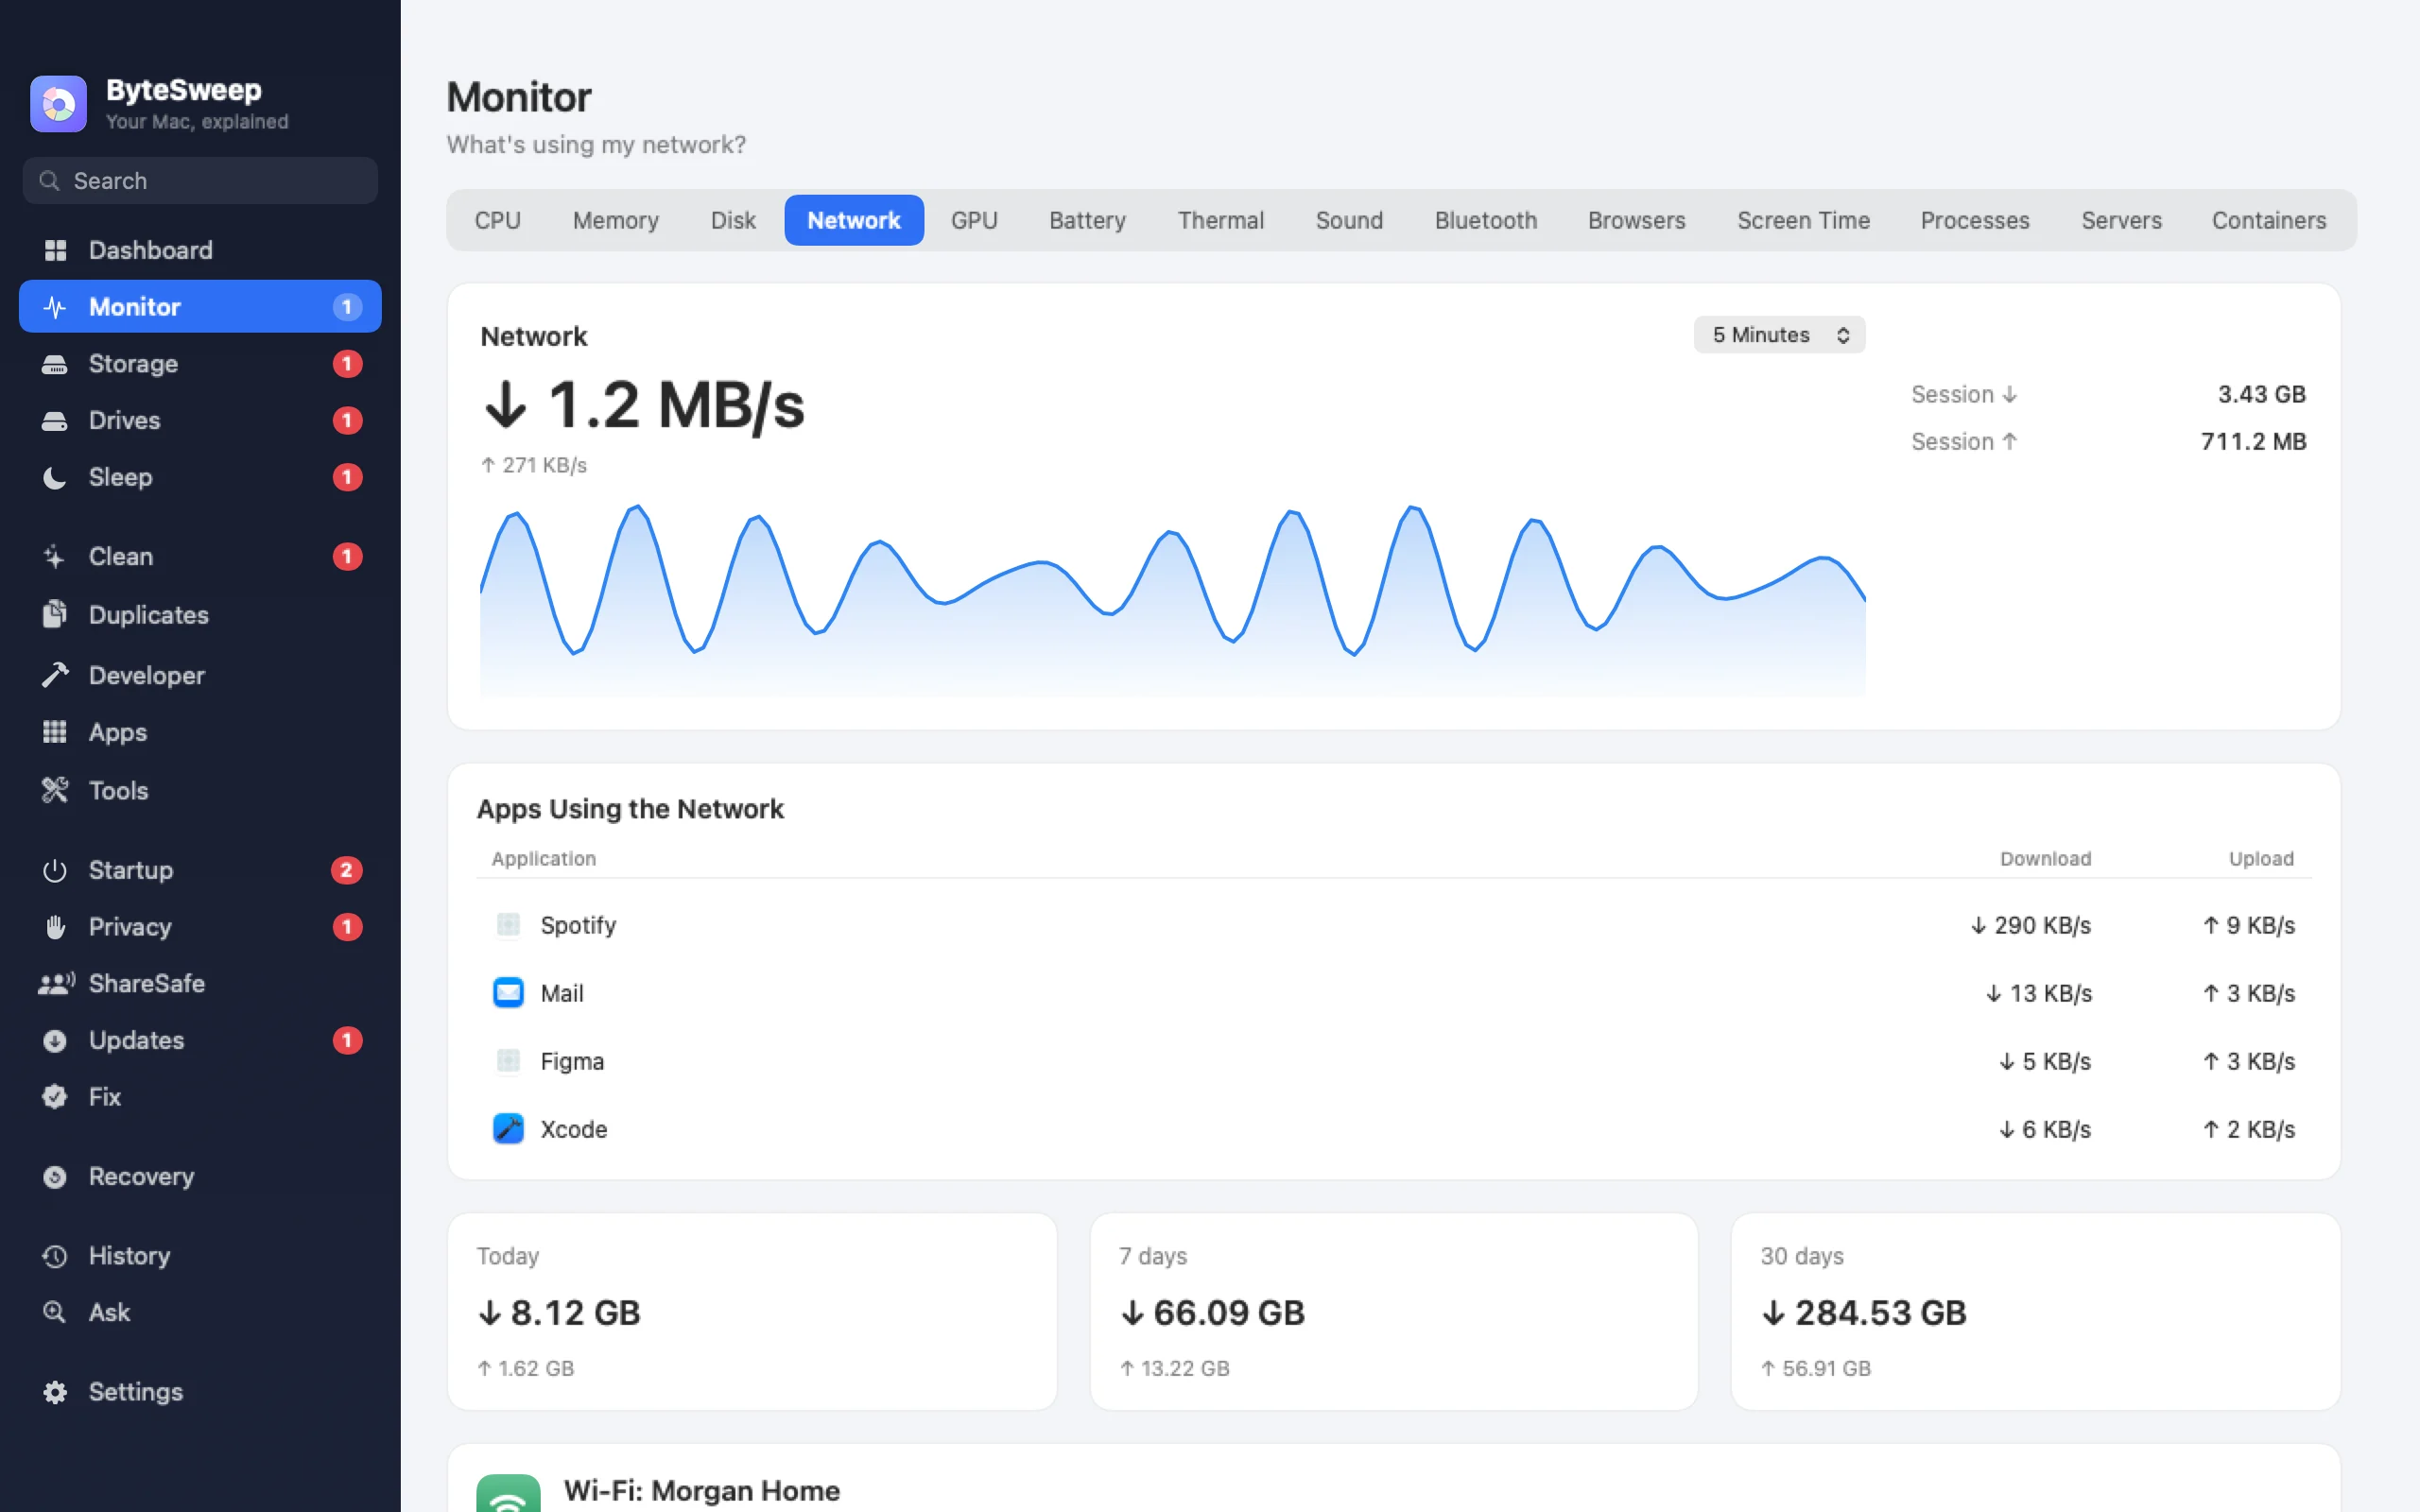
On a Mac, memory is shown as memory pressure, the same signal macOS uses to decide when to compress and swap, so a high number means something. The Mac also shows network traffic per app and an energy estimate per app taken from macOS's own power model.
In the menu bar or the tray, the way you like it
Pick an icon, one figure, a graph, two stacked figures or compact text, on a solid or glass background. From 2.1.0 each reading can also have its own menu bar item (Mac) or tray icon (Windows): CPU, memory, network, disk, temperature and battery, each with a page that drops down from it. They are off until you turn them on, and sample only while shown.
On a Mac the menu bar can quit the app working hardest (Option-click to force it), and names the busiest apps while the fans are up. Apps that are part of macOS are never offered.
Thirty days of history
Bytesweep keeps a reading every minute for a day and every hour for 30 days, in about 95 KB on disk. Look back at CPU, memory, network, disk activity, free space, CPU temperature and battery over 5 minutes, an hour, 12 hours, a day, a week or the month. History stays on your computer, and one switch in Settings turns it off and deletes it.
An alert when an app runs away
Bytesweep notices an app that holds a full CPU core for five minutes, grows its memory by a gigabyte in half an hour, or writes or downloads gigabytes when it should not. You get one notification per app and kind a day at most, and each kind can be switched off.
- CPU held high for 5 minutes
- Memory growing by 1 GB in 30 minutes
- Gigabytes written to disk or sent over the network
- One notification per app per day, at most
Wi-Fi, explained
Monitor → Network reads your Wi-Fi every 3 seconds while it is open: signal, noise, channel, band and width, speed and security, with a plain verdict on what is wrong, if anything. It can scan for networks crowding your channel. There is no speed test, and nothing is sent anywhere.
On Mac and on Windows
| Mac | Windows | |
|---|---|---|
| Live CPU, memory, disk, network, GPU, battery | Yes | Yes |
| Menu bar or tray items per reading | Menu bar | Tray icons |
| History | 30 days | 30 days |
| Network and energy per app | Yes | No (Windows does not expose it cheaply) |
| Memory pressure | Yes | Commit charge instead |
| Runaway-app alerts | Yes | Yes |
| Wi-Fi diagnostics | Yes | Yes |
| Dashboard image to share | PNG, 1200 × 630 | PNG, 1200 × 630 |
Bytesweep vs iStat Menus, Stats and Task Manager
| Bytesweep | iStat Menus 7 | Stats | Task Manager | |
|---|---|---|---|---|
| Price | $29.99 once, with every other tool | $11.99 once | Free, open source | Built in |
| Platforms | Mac and Windows | Mac | Mac | Windows |
| Alerts for runaway apps | Yes | Yes, rule based | No | No |
| Also cleans, uninstalls, recovers | Yes | No | No | No |
Prices as each maker lists them on 1 October 2026.
Questions
Does the monitor slow my computer down?
It samples only what is on screen. Separate menu bar items and tray icons read only while they are shown, and per-app network on a Mac runs only while the Network or Processes page is open.
Can it show GPU use per app?
No. Neither macOS nor Windows offers a public way to read GPU use per app, so Bytesweep shows overall GPU use and GPU memory rather than guess.
Is the monitor free?
Everything is free to look at for the 3-day trial. After that, one licence unlocks the monitor and every other tool.